Guide on Creating System Graphs on HMI Interface Screen
To observe parameter changes of a specific object over time, we establish a graphical representation of the relationship between parameter of interest for controlled object and time. INVT’s VT Designer software provides support for ‘Historic Trend Graph’ tool, which relies on parameters initialized through ‘dataloggers,’ making system monitoring through graphs easier.

– Implementation Steps:
Step 1: Create parameters for the graph to display.
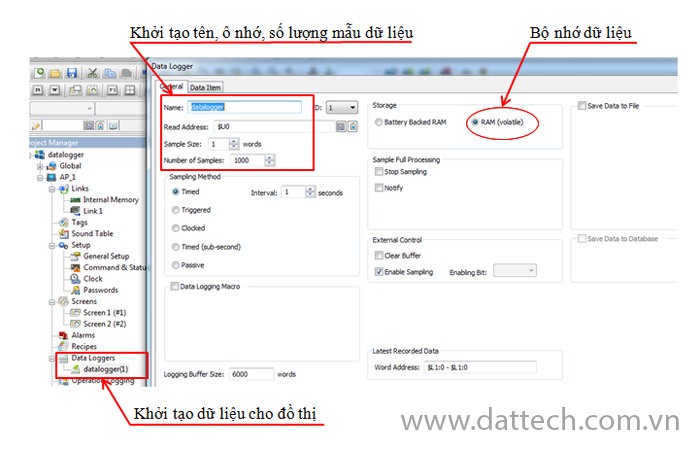
Go to Project Manager -> Right-click on ‘Dataloggers’ -> Add data logger -> a ‘Data logger’ window is created -> Click on the object -> General -> initialize the parameters:
- Name: Set a name for the data.
- Read adress: Memory address.
- Sample size
- Number of sample: the number of samples.
- Timer sample: Sampling time.
- Storge: Data storage location.
– Click on the ‘Data Item’ Tab -> initialize the graph lines with any system data. Depending on the designer’s requirements, you can create as many graph lines as needed.

– Click on the icon ![]() on the ‘Toolbar’ bar.
on the ‘Toolbar’ bar.
– Click on the ‘Historic Trend Graph’ that you just created -> go to the ‘General’ Tab to set general properties for the object.
- Shape: Choose a color.
- Cursor: Data cursor.
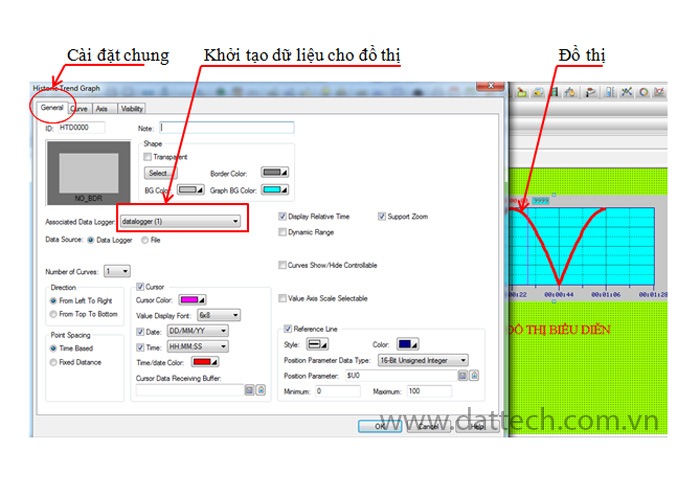
- Acssociated datalogger: Add the datalogger file created earlier -> Create a curve file in the ‘Historic Trend Graph’ window of the graph.
- Reference line: Set the reference line value (predefined value).
– Position parameter : Memory address for referencing.
– Input Min, Max values.
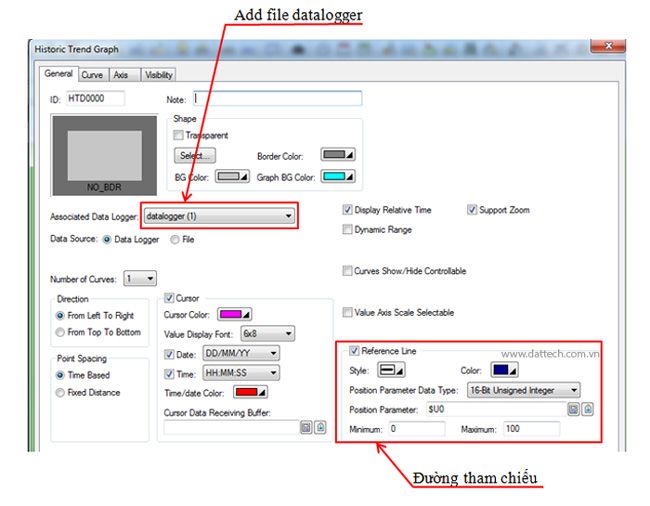
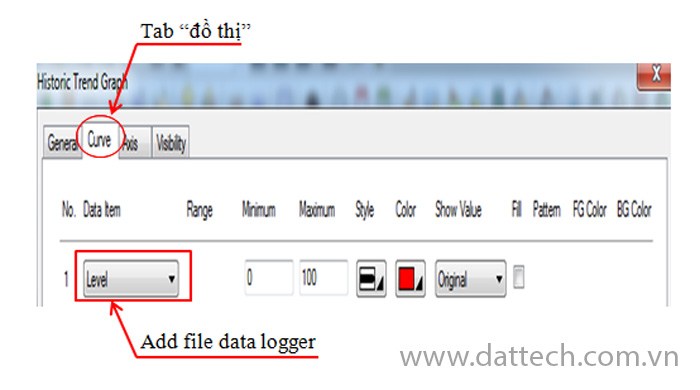
– When the ‘Datalogger’ file is added, it will create a ‘Curve’ tab in the ‘Historic Trend Graph’ window -> Click on the ‘Curve’ tab -> Configure properties (color, line style, or block shape…).
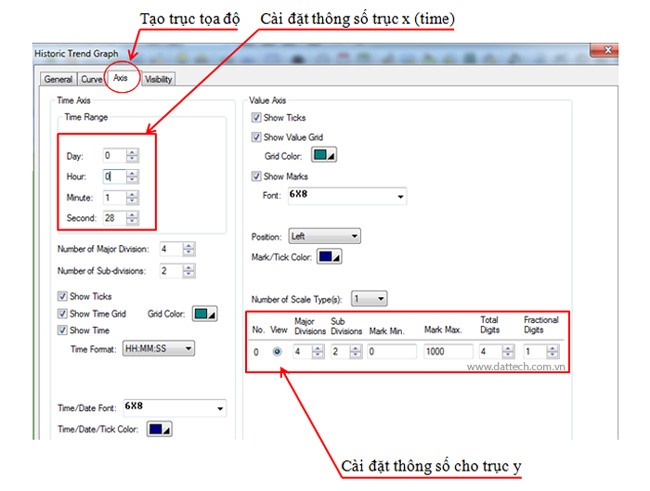
– Click on the ‘Axis’ Tab -> Configure X and Y coordinates for the graph representation.
- X-axis is the ‘Time Axis’: Set up date, hour, minute, and second.
– Number of major divisions : the number of main divisions on the x-axis.
– Number of sub-Major division : the number of sub-divisions on the x-axis.
Note: The date, hour, minute, and second units should be multiples of the main divisions on the coordinate axis.
- Y-axis is the ‘Value Axis.’
– Set Min, Max values, position, and color…